Today’s ecommerce marketers have a tough job. Their main objective: get the messaging out about the store and deliver sales. You have the website at your disposal and a mediocre advertising budget.
The challenge for you, as an ecommerce marketer, is how do you compete against a service like Amazon? They’re big, they can undercut your prices, and they can handle low margins while you cannot.
You need to optimize everywhere you can, including your funnel and your marketing channels, and you need to build a loyal customer base. Fortunately, Kissmetrics is here to help. Our software provides insights that can help visitors into customers. And once you get those customers, we provide data that can help you acquire more of the loyal ones.
Let’s see how.
1) Purchase Funnel – See Where You’re Losing Customers
Every website has a set of steps visitors need to go through before they can purchase. The Kissmetrics Funnel Report is used to help marketers identify the areas of their website where visitors depart. Once they identify those areas, they can then A/B test their way to growth.
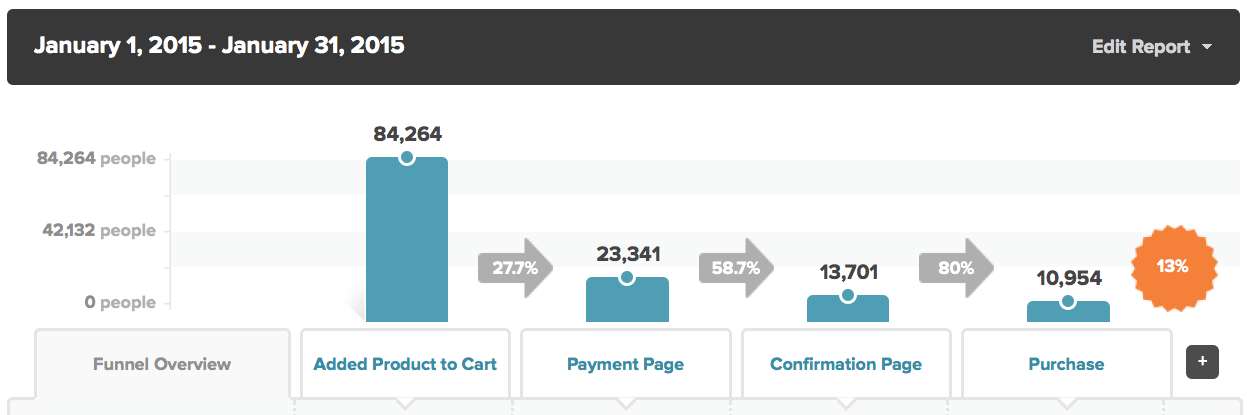
Here’s how a funnel for an ecommerce site might look:

What we know from viewing this graph is that visitors have two big roadblocks to becoming customers. Of those who view the product page, only 33% convert to adding a product to their cart. And once they do add a product to their cart, only 13% of them end up purchasing. If you’re a marketer and this is your data, you know you can do better than a 13% conversion from cart to purchase. And if you do improve, you’ll end up getting more purchases for your company. Cha-ching!
To get you on your path to increased purchases, you’ll need to run A/B tests on the product pages and throughout the shopping cart checkout process (more on that later). You can create your A/B tests in whichever tool you use – Optimizely, VWO, etc. – and then track the results with the Kissmetrics A/B Test Report.
The cool thing about this report is that you can see how an A/B test impacts your entire funnel. So if you run a test on the product page, you can see how it impacts further on down the funnel, all the way to the purchase! You aren’t limited to testing only to the next conversion step.
You can also set up a funnel to view how people move through the checkout process. Let’s get into that now.
2) Funnel Report – See Where Customers Drop Off in the Checkout Funnel
You can break funnels into two categories – macro and micro. The macro funnels take a bird’s-eye view of your site, often viewing your whole site. The purchase funnel is a lot like that. It goes from the start of the funnel all the way to the end. A micro funnel allows marketers to zoom in and see a specific flow within their site. A funnel report on the checkout funnel is one example.
Here’s how it might look:
Looking at this graph, where would you say drop-off is occurring?
Without question, most people who end up putting a product in their cart don’t even advance to the next step in the funnel (the Payment Page). If we can increase the people who convert from the Added Product to Cart page to Payment Page, we’ll have a pretty linear increase in purchases.
So if you’re a marketer and you want to increase conversions (who doesn’t), here’s what you do:
- Use the Kissmetrics Funnel Report to see where visitors are dropping off.
- Run A/B tests on those pages. Track the tests in the Kissmetrics A/B Test Report. The more tests you run, the more winners you’ll find, and the more purchases you’ll bring.
With Engage from Kissmetrics, you’ll be able to put modals on your site that can increase conversions. A lot of our customers have experienced a conversion boost by using Engage.
The best marketers are able to drive loyal customers. Lucky for marketers, Kissmetrics has a report that shows marketers where their most loyal customers come from.
Click here to watch a short demo of the Kissmetrics Funnel Report.
3) Cohort Report – Find Customers Who Repurchase
Businesses live and die on their ability to attract and retain customers. To track customer retention, marketers can create a cohort report that shows them how often customers come back and repurchase products. They can even group them together and see which products or product lines have people coming back for more.
A cohort is a group of people who share a common characteristic or experience within a defined period. For example, people who purchased from your site during April are in a cohort because they all did one thing (purchase) during a defined period (April).
Taking this a step further, the Kissmetrics Cohort Report allows you to group people by any characteristic and then segment them by any property. Let’s see this in action.
We want to track repurchase rates (i.e., people who purchase, then purchase again). We can find those people, but what do we group them by? Time? Marketing channel? Product? Product category? As long as you’re tracking the property in Kissmetrics, you can segment people by it.
Let’s use marketing channel as our example. This segments people by the channel they came from. The higher the percentages (darker shade of blue), the better.

On the left side we get the number of people from each channel who have purchased. This is not a traffic report. We’re looking at purchases. We see that most of our purchases are from people in the Social channel. The right side (all the blue shaded cells with percentages in them) shows us how many of those people came back and purchased again, by month.
Social looks like it delivers a lot of purchases and repurchases. If we can acquire more people from this channel, chances are we’ll be acquiring loyal customers. The more targeted we can make our marketing, the more loyal customers we’ll attract. And businesses that win have loyal customers.
As mentioned above, we aren’t limited to grouping people only by channel. We can group them by product (see which products get the most repurchases), product line, any UTM parameter, time, etc. As long as you track it, you can get the data that matters to you.
Click here to watch a short demo of the Kissmetrics Cohort Report.
4) Revenue Report – See Which Products Bring the Most Valuable Customers
Your revenue is probably coming from dozens (hundreds) of sources. Maybe a feature on CNN got you a ton of orders, or you get a lot of purchasers coming from Google searches.
The Kissmetrics Revenue Report is used to segment your revenue and see which sources are bringing you the most valuable customers. Here is how it could look for a company selling clothes:

We’re segmenting revenue by collection (aka product category). The In-House Generic Tees bring tons of revenue (over $630k) and customers (over 9,700). The other metrics (average revenue/person, lifetime value, and churn) tell us how valuable these collections are for our business. We want high numbers on average revenue/person and lifetime value, but low percentages for churn. (Churn represents the percentage of people who ordered from that collection but did not order again within a defined time period.)
Just like the Cohort Report in the above section, we aren’t limited to segmenting only by collection. We can also segment by marketing channel, so we can see which channels bring us the most valuable customers. By the way, the channels property works automatically in Kissmetrics. There are no custom rules or custom code needed.
Click here to watch a short demo of the Kissmetrics Revenue Report.
5) People Search – Find People Who Have Abandoned Their Cart
The biggest problem for a lot of ecommerce companies is customers who abandon their cart. They view a product, add it to their cart, but never return again. They’re missing out on a big opportunity if they don’t make an effort to re-engage these people. If marketers can get them re-engaged (through cart abandonment emails) they are giving themselves a better shot at recapturing these lost orders.
The problem for many marketers is they don’t know where to start to get a list of these people. The Kissmetrics People Search makes this process easy. All you have to do is set your criteria to get a list of people you are looking for. There is no need to bug engineers to run a SQL query.
Here’s what our criteria looks like. We’re looking for people who have added a product to their cart but have not purchased. We want to see all the people who fit this criteria in the past 7 days.
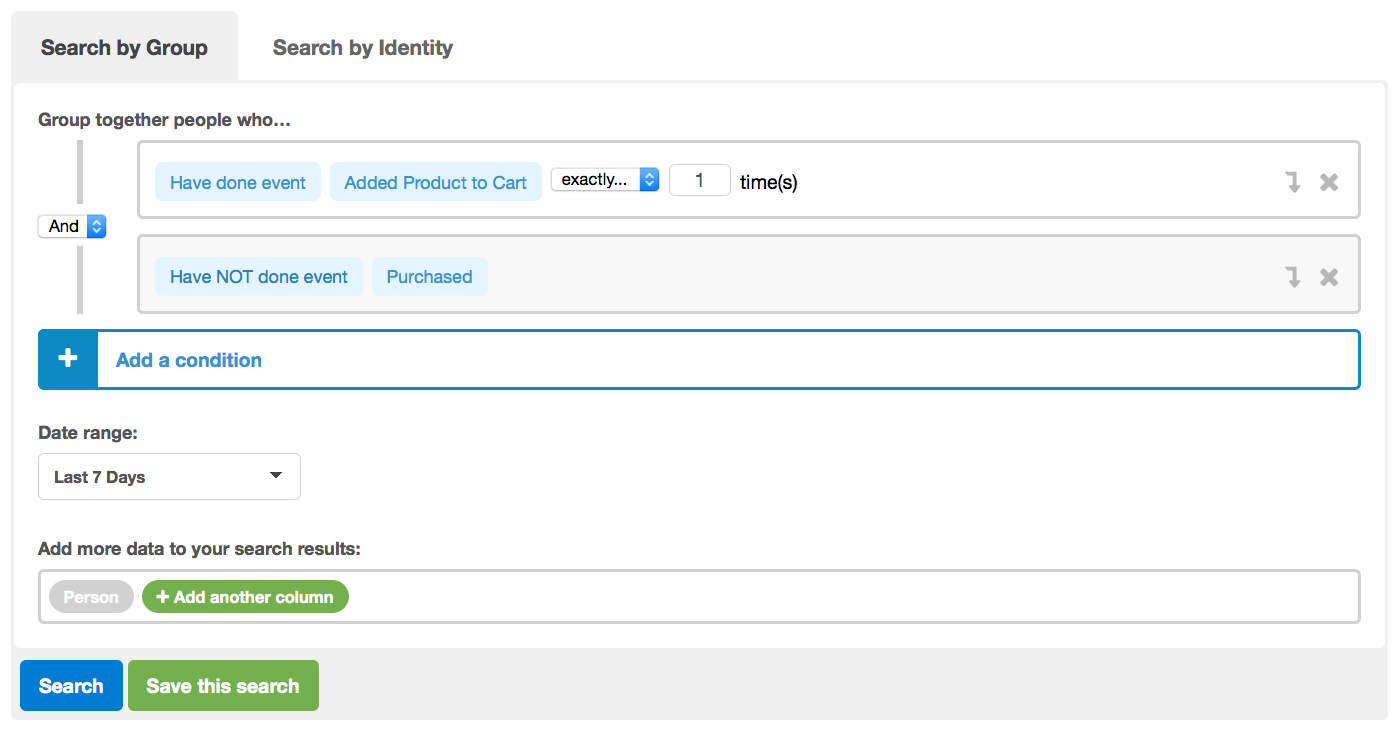
We click Search and get our list of people:
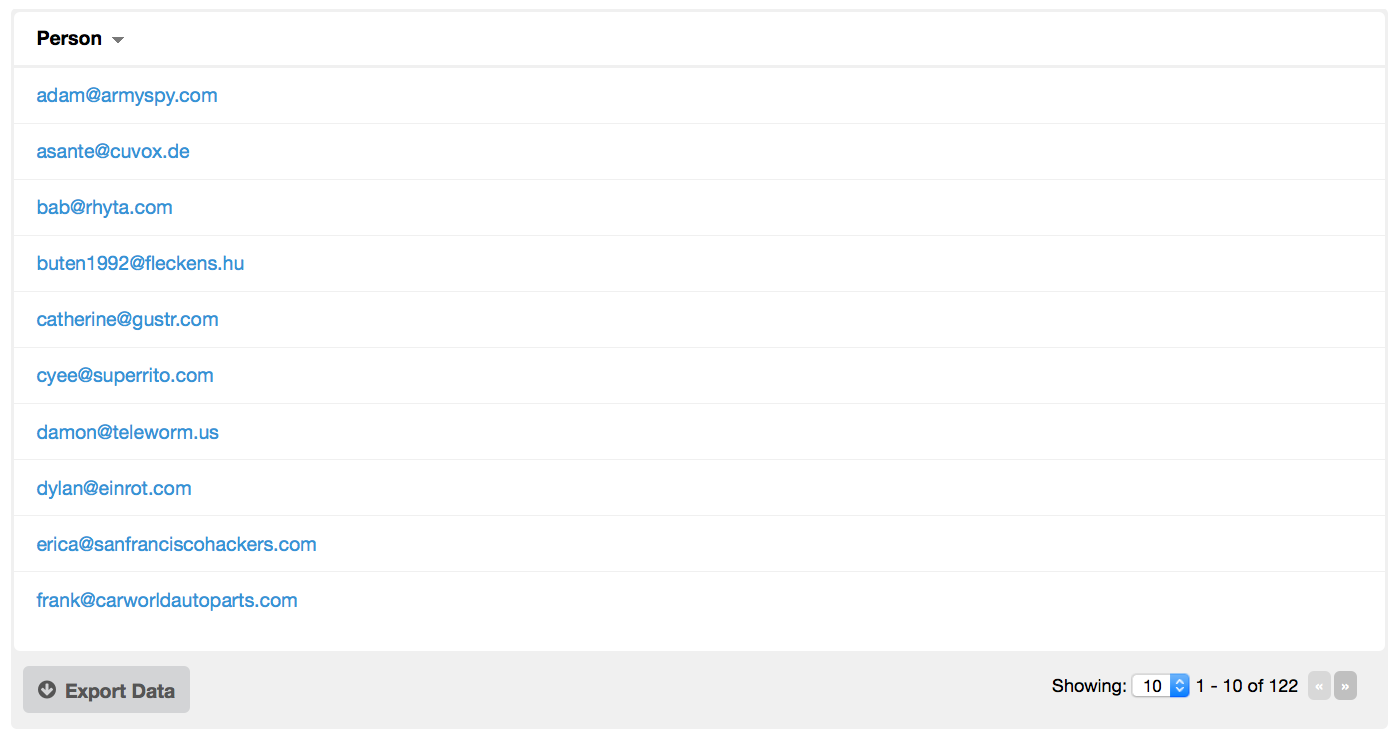
There are a few things we can do with this list:
- We can click on each person and get a Person Details report. This will show us all the events and properties the person triggered (i.e., what they’ve done on the site) as well as tell us the last time they were seen.
- We can export the list to a CSV file and then upload it into an email service provider like MailChimp and send an email to each person to get them re-engaged and hopefully recover some lost sales.
Important note: You’ll get a list of email addresses only under certain circumstances:
- You identify people by their email address.
- The people are already signed up or registered with you.
Click here to watch a short demo of the Kissmetrics People Search.
Optimize Your Marketing with Kissmetrics
These are just a few examples of what Kissmetrics can do for ecommerce companies. Our reports are more than useless metrics – they provide insights into how users are behaving on your site. Once you see this data, you’ll know what needs to be improved. Once you see this data, you’ll know what needs to be improved.
Head on over to the Demo site and see how Kissmetrics works for ecommerce sites. Or better yet, schedule a personalized demo.
Ready to get straight into the action? Just click the button below to sign up for a free 2-week trial of Kissmetrics.

About the Author: Zach Bulygo (Twitter) is a Content Writer for Kissmetrics.
No comments:
Post a Comment